Originating from the Canadian game show 'Let's make a deal', the Monty Hall problem is one of the most misunderstood brain teasers. For those unaware of the problem it goes as follows.
Imagine you are on a game show and in front of you there are three doors. Behind one of the doors is a brand new sports car. Behind the other two, goats. Now unless you are a particular fan of goats, you want to pick the door with the car behind it, right? So far so simple. Now here's where it gets complicated. After you have made your initial choice of which door to pick, the host opens one of the doors you didn't pick to reveal a goat and asks you if you would like to change. Do you? The answer, suprsisingly enough, is a categorical yes. Let me explain why by first drawing attention to two key pieces of information you need to keep in mind.
Your first choice is wrong
The most important thing you should keep in your mind is that your initial choice is most likely wrong. Specifically you have a 66.667% chance of picking one of the goats and only a 33.333% chance of picking the car. Moving onto the second stage, given that we know that our initial choice was likely wrong, it makes sense to change to the other door if given an oppourtunity.
The removed door is always a goat
In the second stage of the game, one of the goat doors is removed from the game. This piece of information is incredbly inportant when you combine this piece of information with the fact that our first choice is wrong. As this presents an outcome where we pick one of the goats, the other is removed, and we switch to the door with the car behind it. Given that we know we'll pick a goat around 66.67% of the time, thus falling into our most likely outcome, we can think that our win probability will also be around 66.67%. As opposed to 33.33% if we didn't change.
Still don't believe me? Need more proof? Well I wrote some code for this exact purpose. The graph below shows the win percentage for each strategy simulated for 10 rounds of 200 games of 'Let's make a deal'. The code for a version of which is located on my Github.
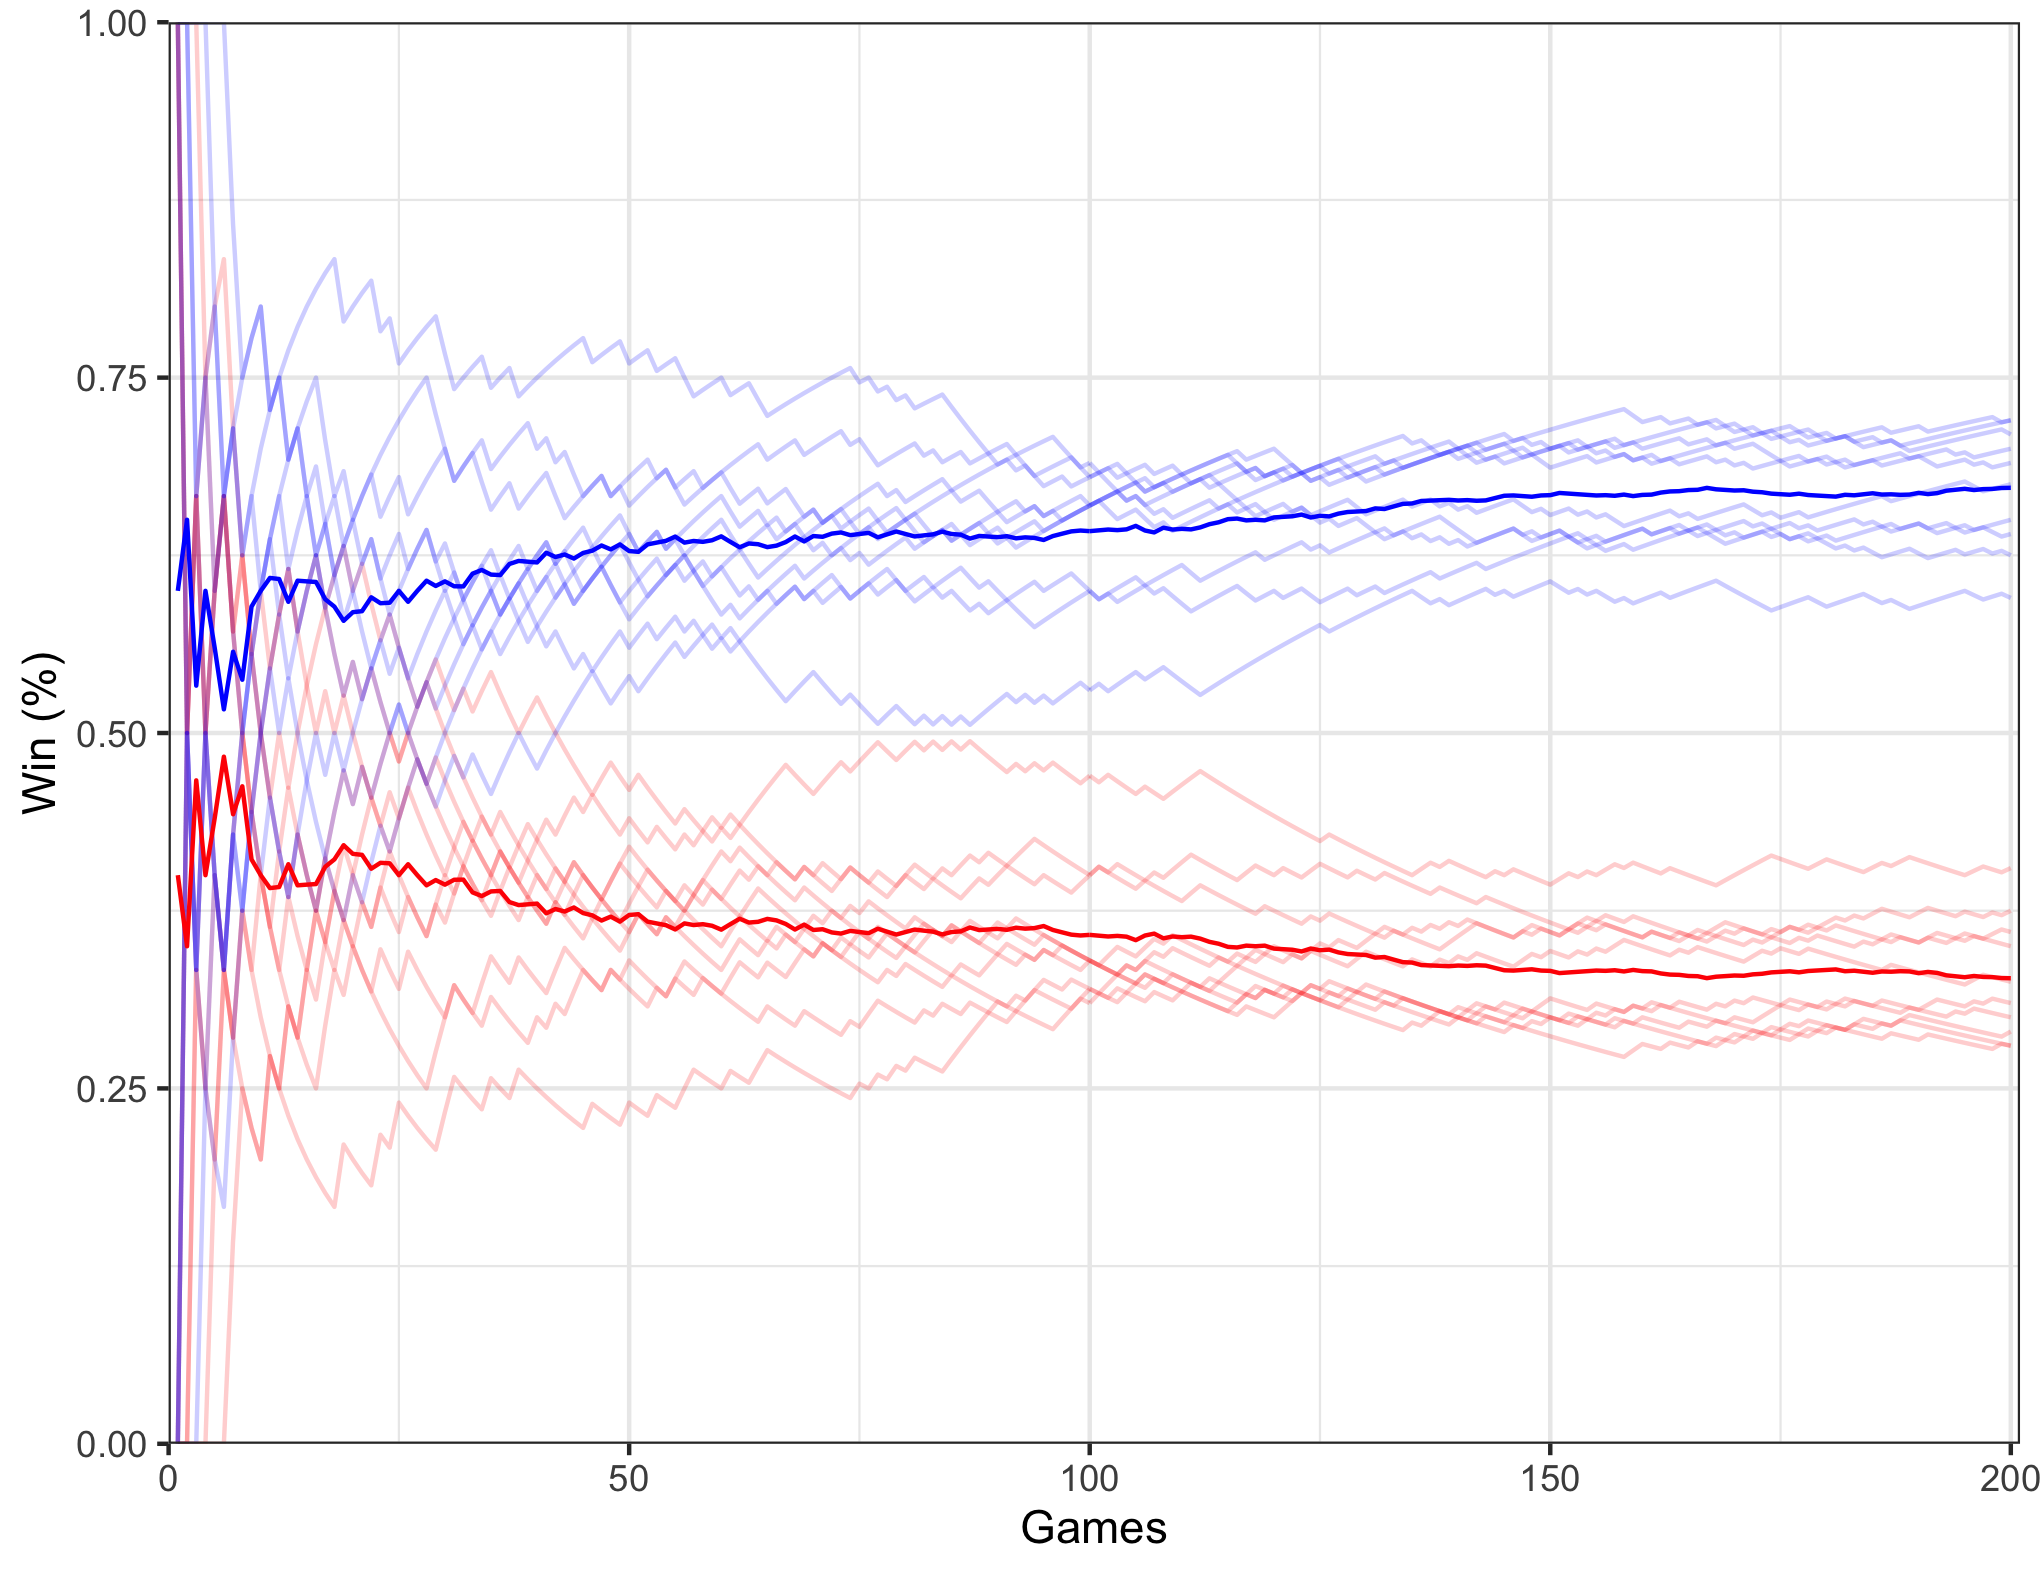
The red lines show the win probabilities for the no-change strategy, while the blue lines show the win probabilities for the changing strategies. The fainter lines indicate the outcomes for each set of games, while the darker lines indicate the average win percentage for these sets.
Briefly looking over this graph, the superiority of the changing strategy over the non-changing strategy becomes clear. Further, if we look at the final average standings for each strategy they closely resemble our estimated win probabilities. As the changing strategy won 67.25% of their games, whilst the non-changing strategy won 32.75% of their games.