How would you predict an election? Elections are events with far-reaching consequences, but how would you forecast an election.
Votes or Seats
One method might be to predict the number of votes earned by each party. Whichever party wins the most votes will be the forecasted winner. But just because a party, or candidate, earns more votes than another doesn't necessarily mean that that they'll be in government at the conclusion of the election. Examples of this are easy to come by, especially from the USA. In the UK too, vote share doesn't necessarily correlate with the number of seats won by each party. As the graph below should testify.
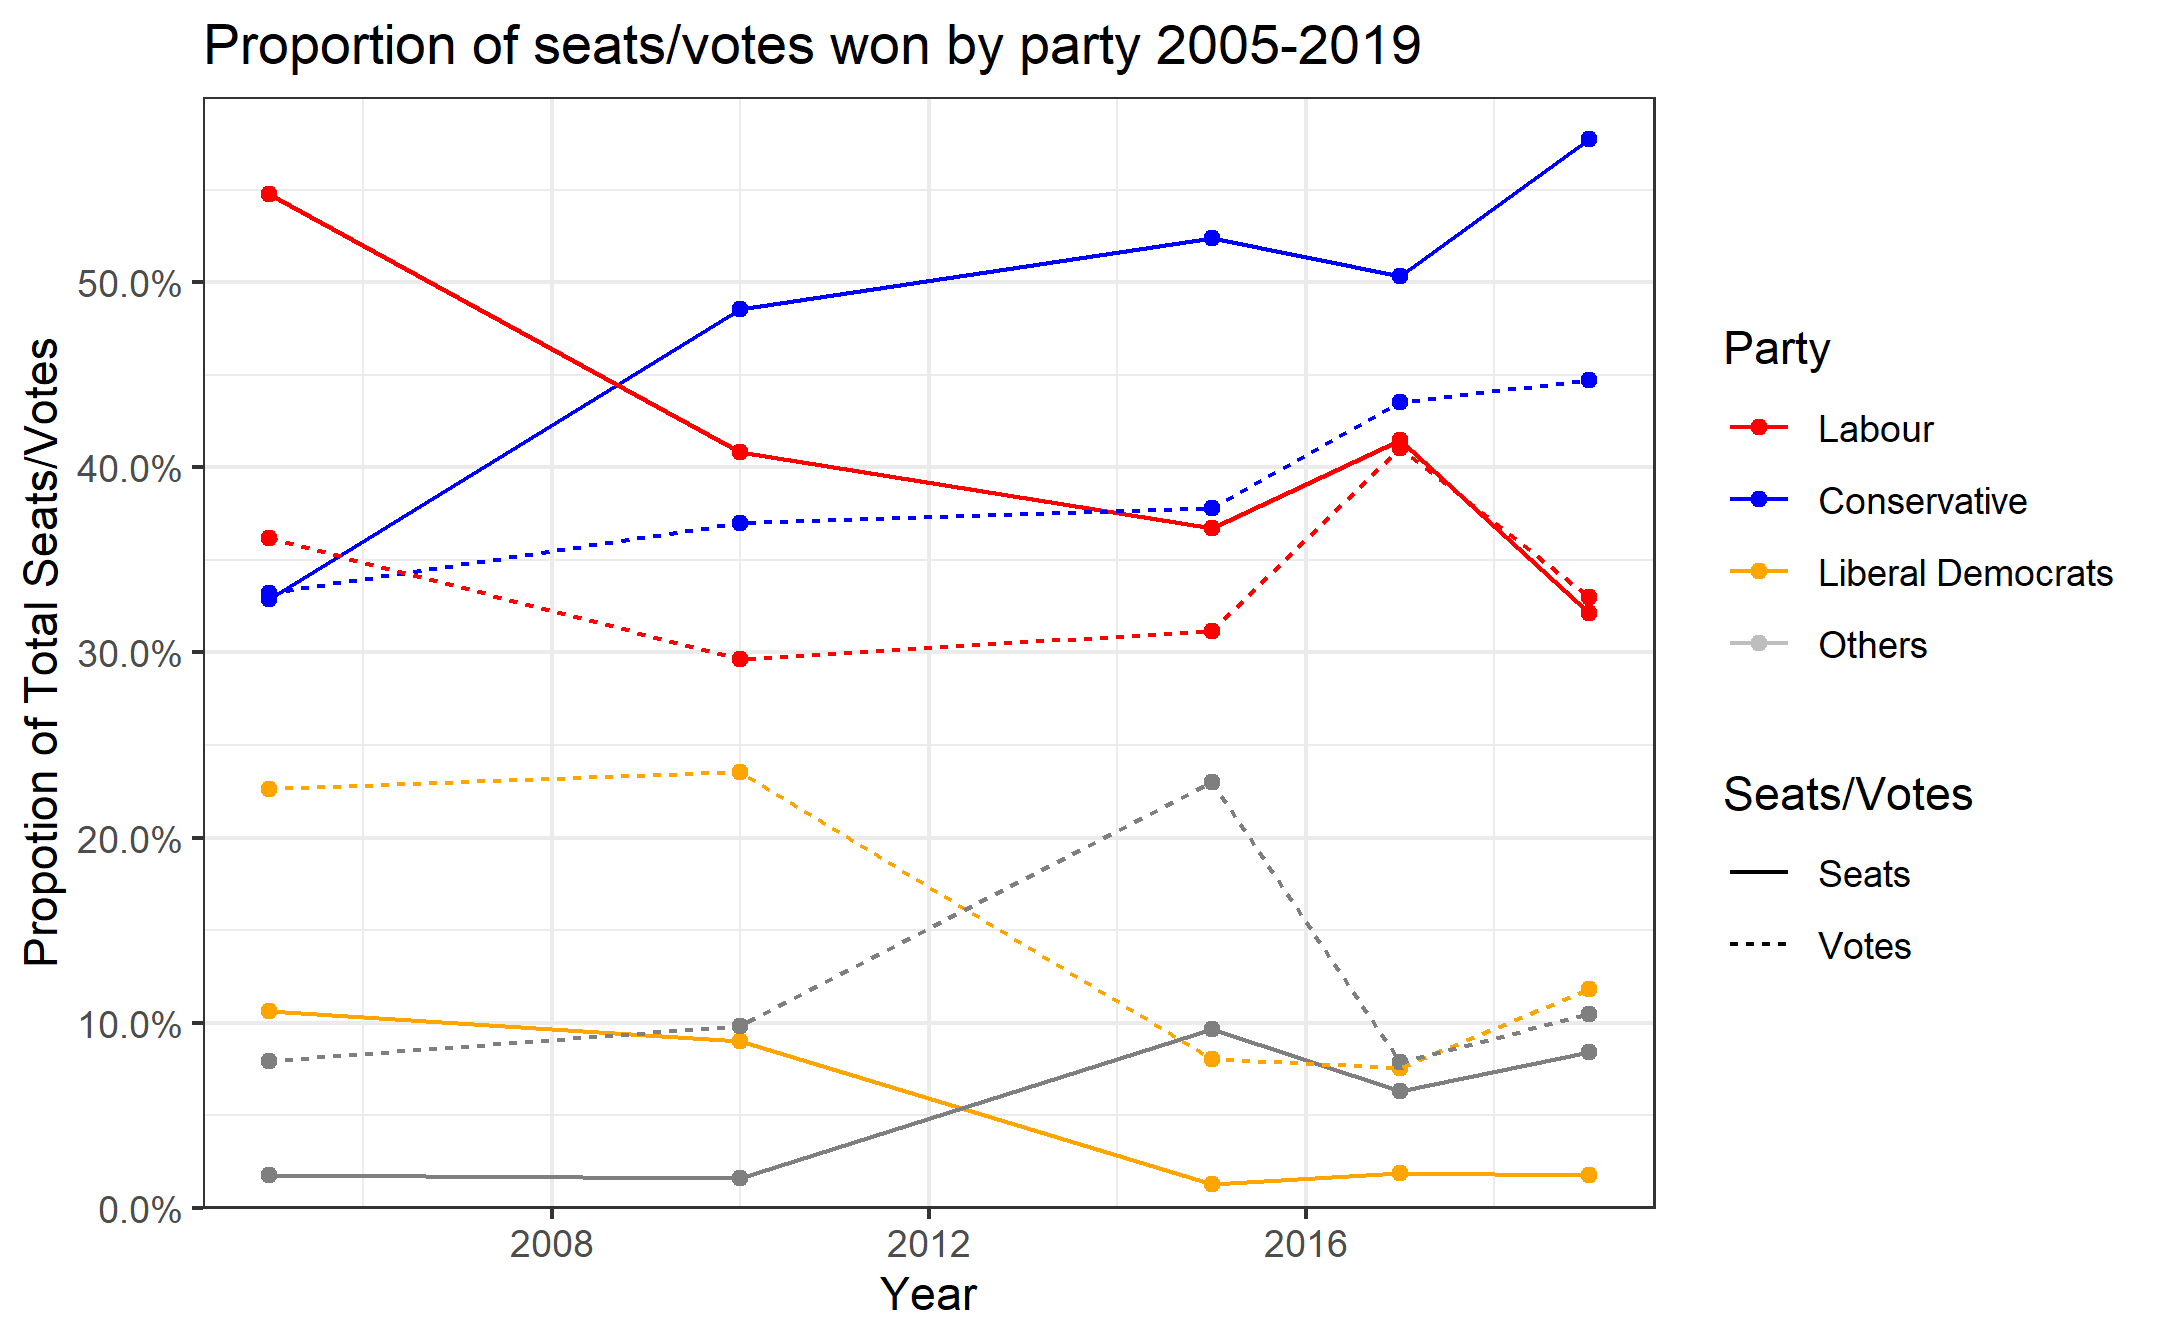
It is also interesting to note from this graph, that while three majority governments were formed between 2005-19. No party has received over a majority of the votes cast in any election during this period. Again showcasing the importance of focussing on seats for any forecast of UK elections.
The Fundamentals Approach
When practitioners are forecasting an election, they will often begin with the 'fundamentals'. These include socio-economic and demographic variables that we theorise will have an impact on voting behaviour. The rationlity being that we would expect areas with a younger population to vote differently than those with an older population, richer different than poorer, etc. For this model, I have constructed variables using the following data:
- Census data from 2011
- House price data
- National macroeconomic and socioeconomic data
Using that data we can construct a basic model to predict the results in each constituency, the results of which are shown below
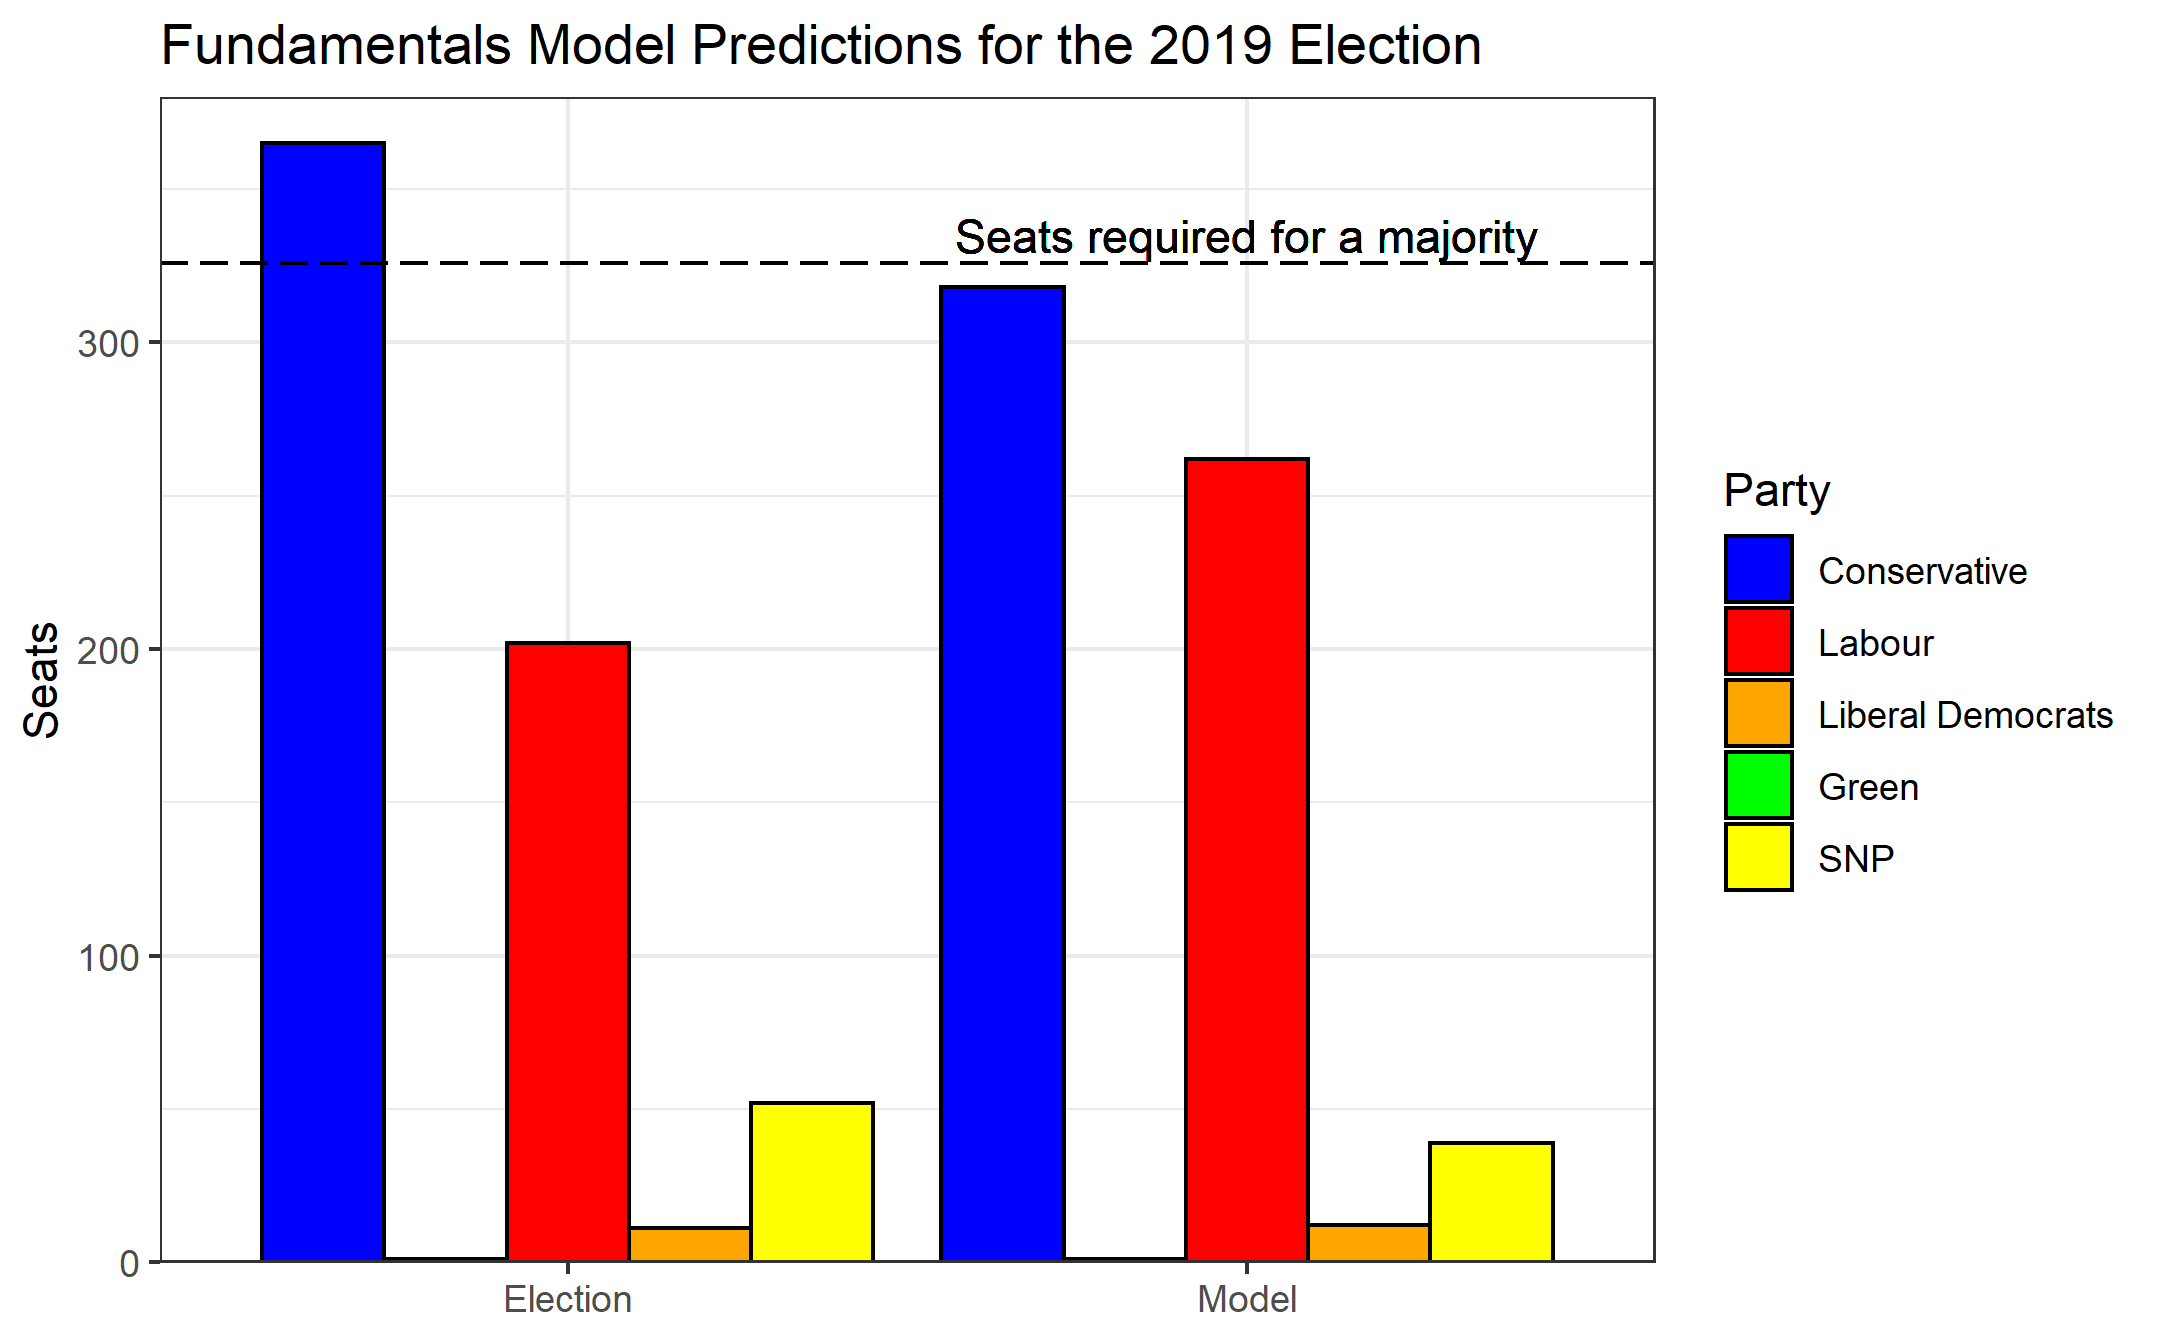
Focussing on the fundementals, we have a fairly accurate model that would have correctly predicted around 80% of the seats. However, this model would have incorrectly predicted the overall result as a Conservative minority government rather than the ma. Although imperfect, it's certainly a start. The next step should naturally be to add indicators of public political opinion; the polls.
Polling and Models
Now we have a basic model from the fundementals approach, we can then further refine the model using polling data. But how good are the polls? For example, here is the polling data leading up to the 2005 election.
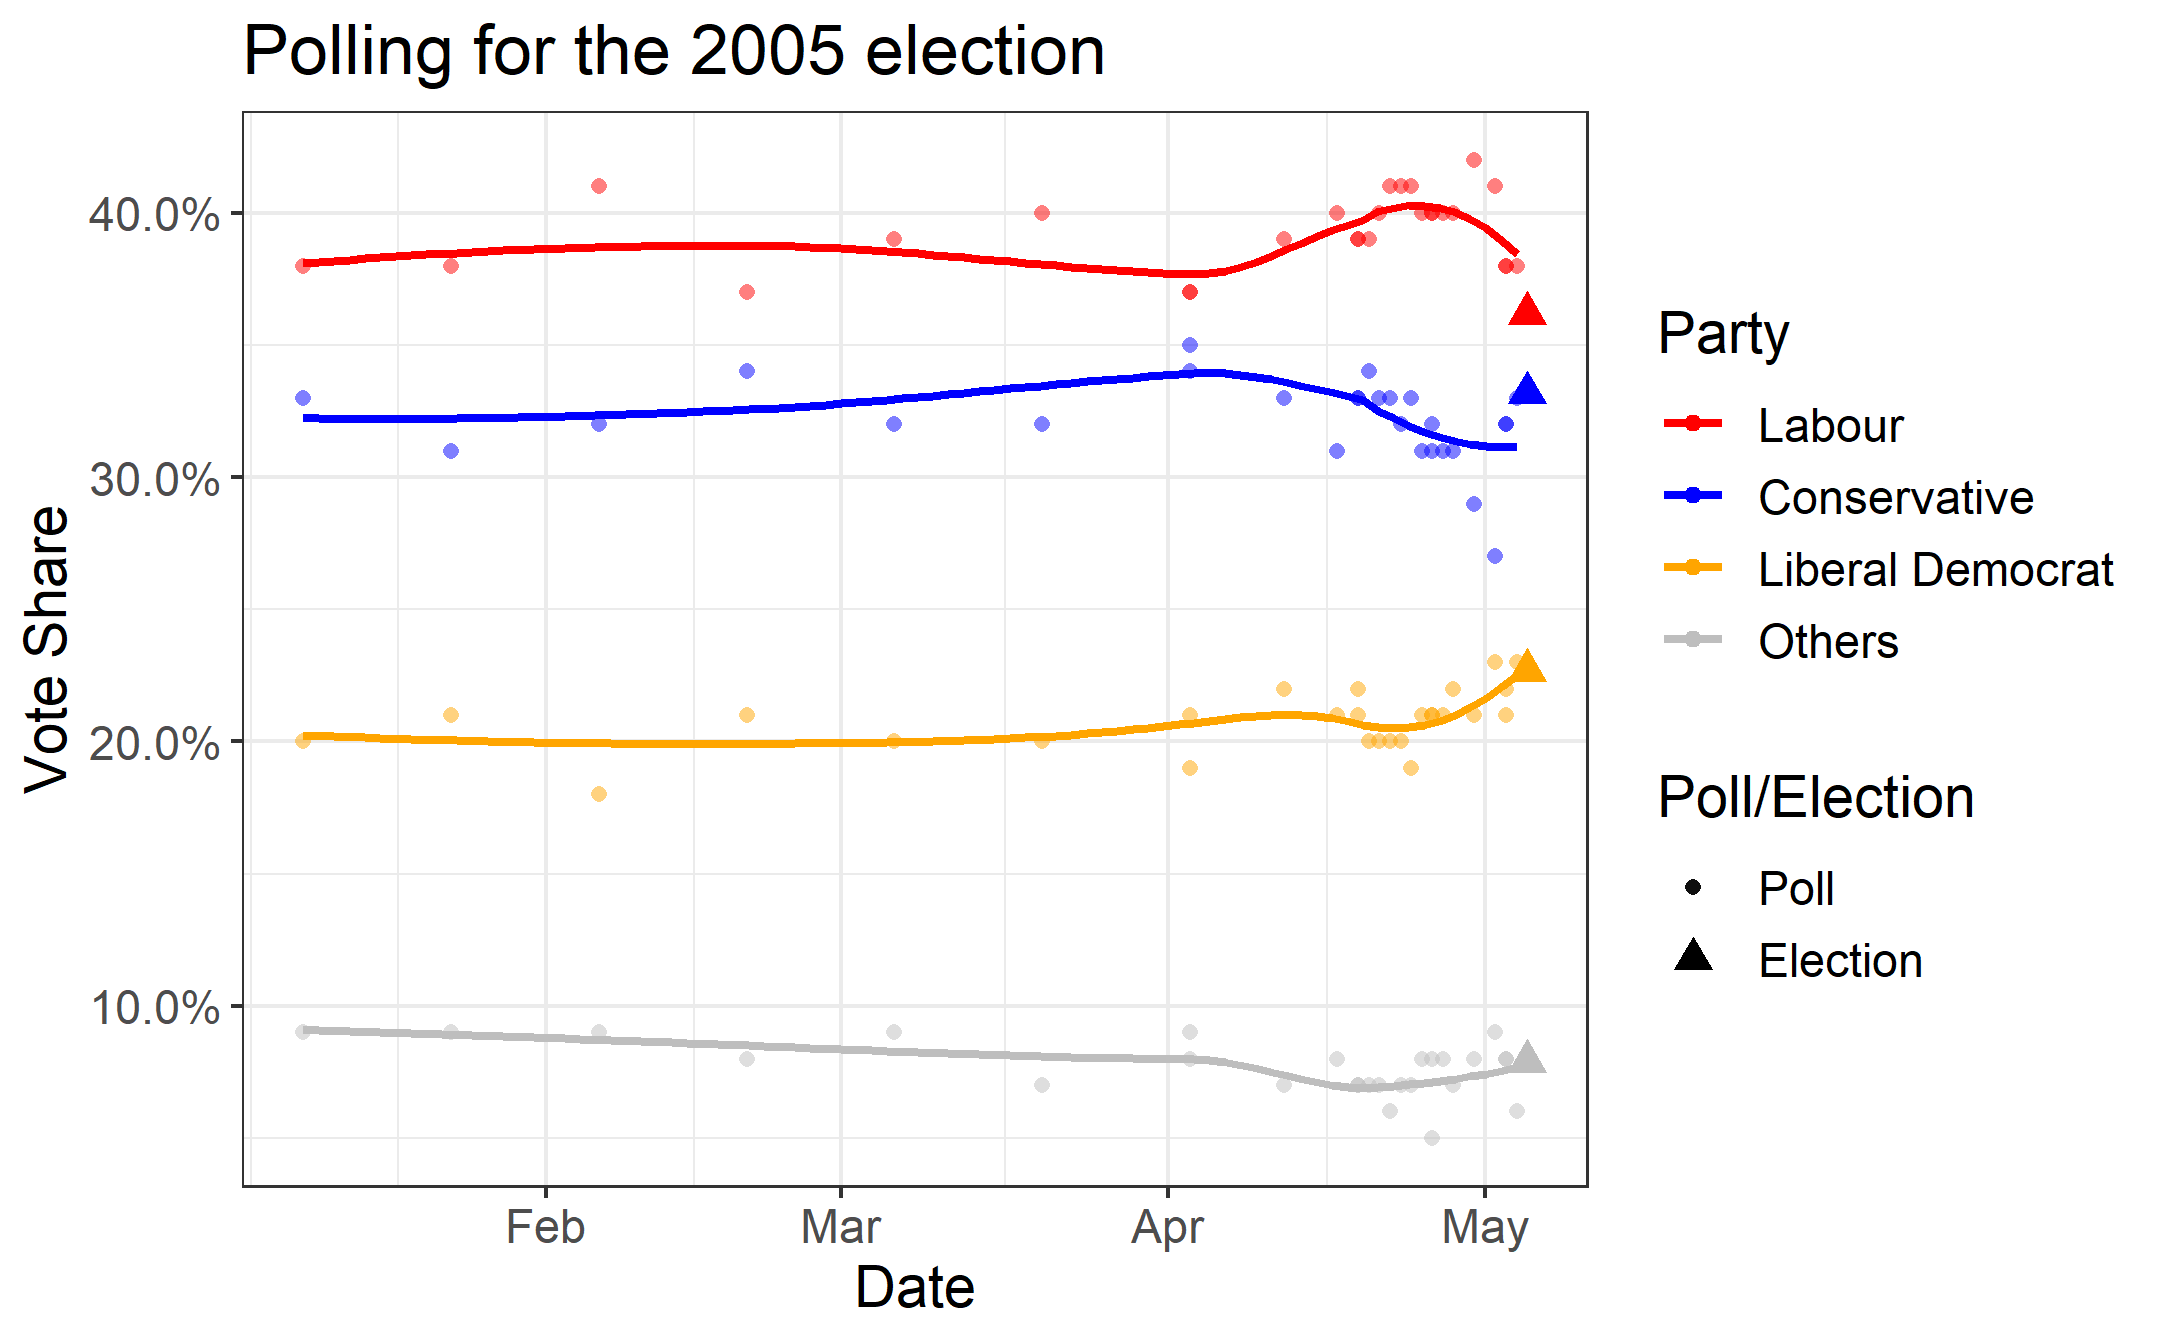
Looking at the polling, the race seemed pretty steady with Labour in the lead all the way until election day. The polls even correctly predicted the vote shares for both the Liberal Democrats and combined other parties, as both final results were within their LOESS model's standard errors. However, the models for the Labour and Conservative parties missed the mark, perhaps owing to late swings from the former to the latter at the polling booth.
Not all races are as stable as the election of 2005 however. Indeed more recent elections have exposed some of the issues with forecasting elections using polls. Take the polling for the 2010 election dispayed below.
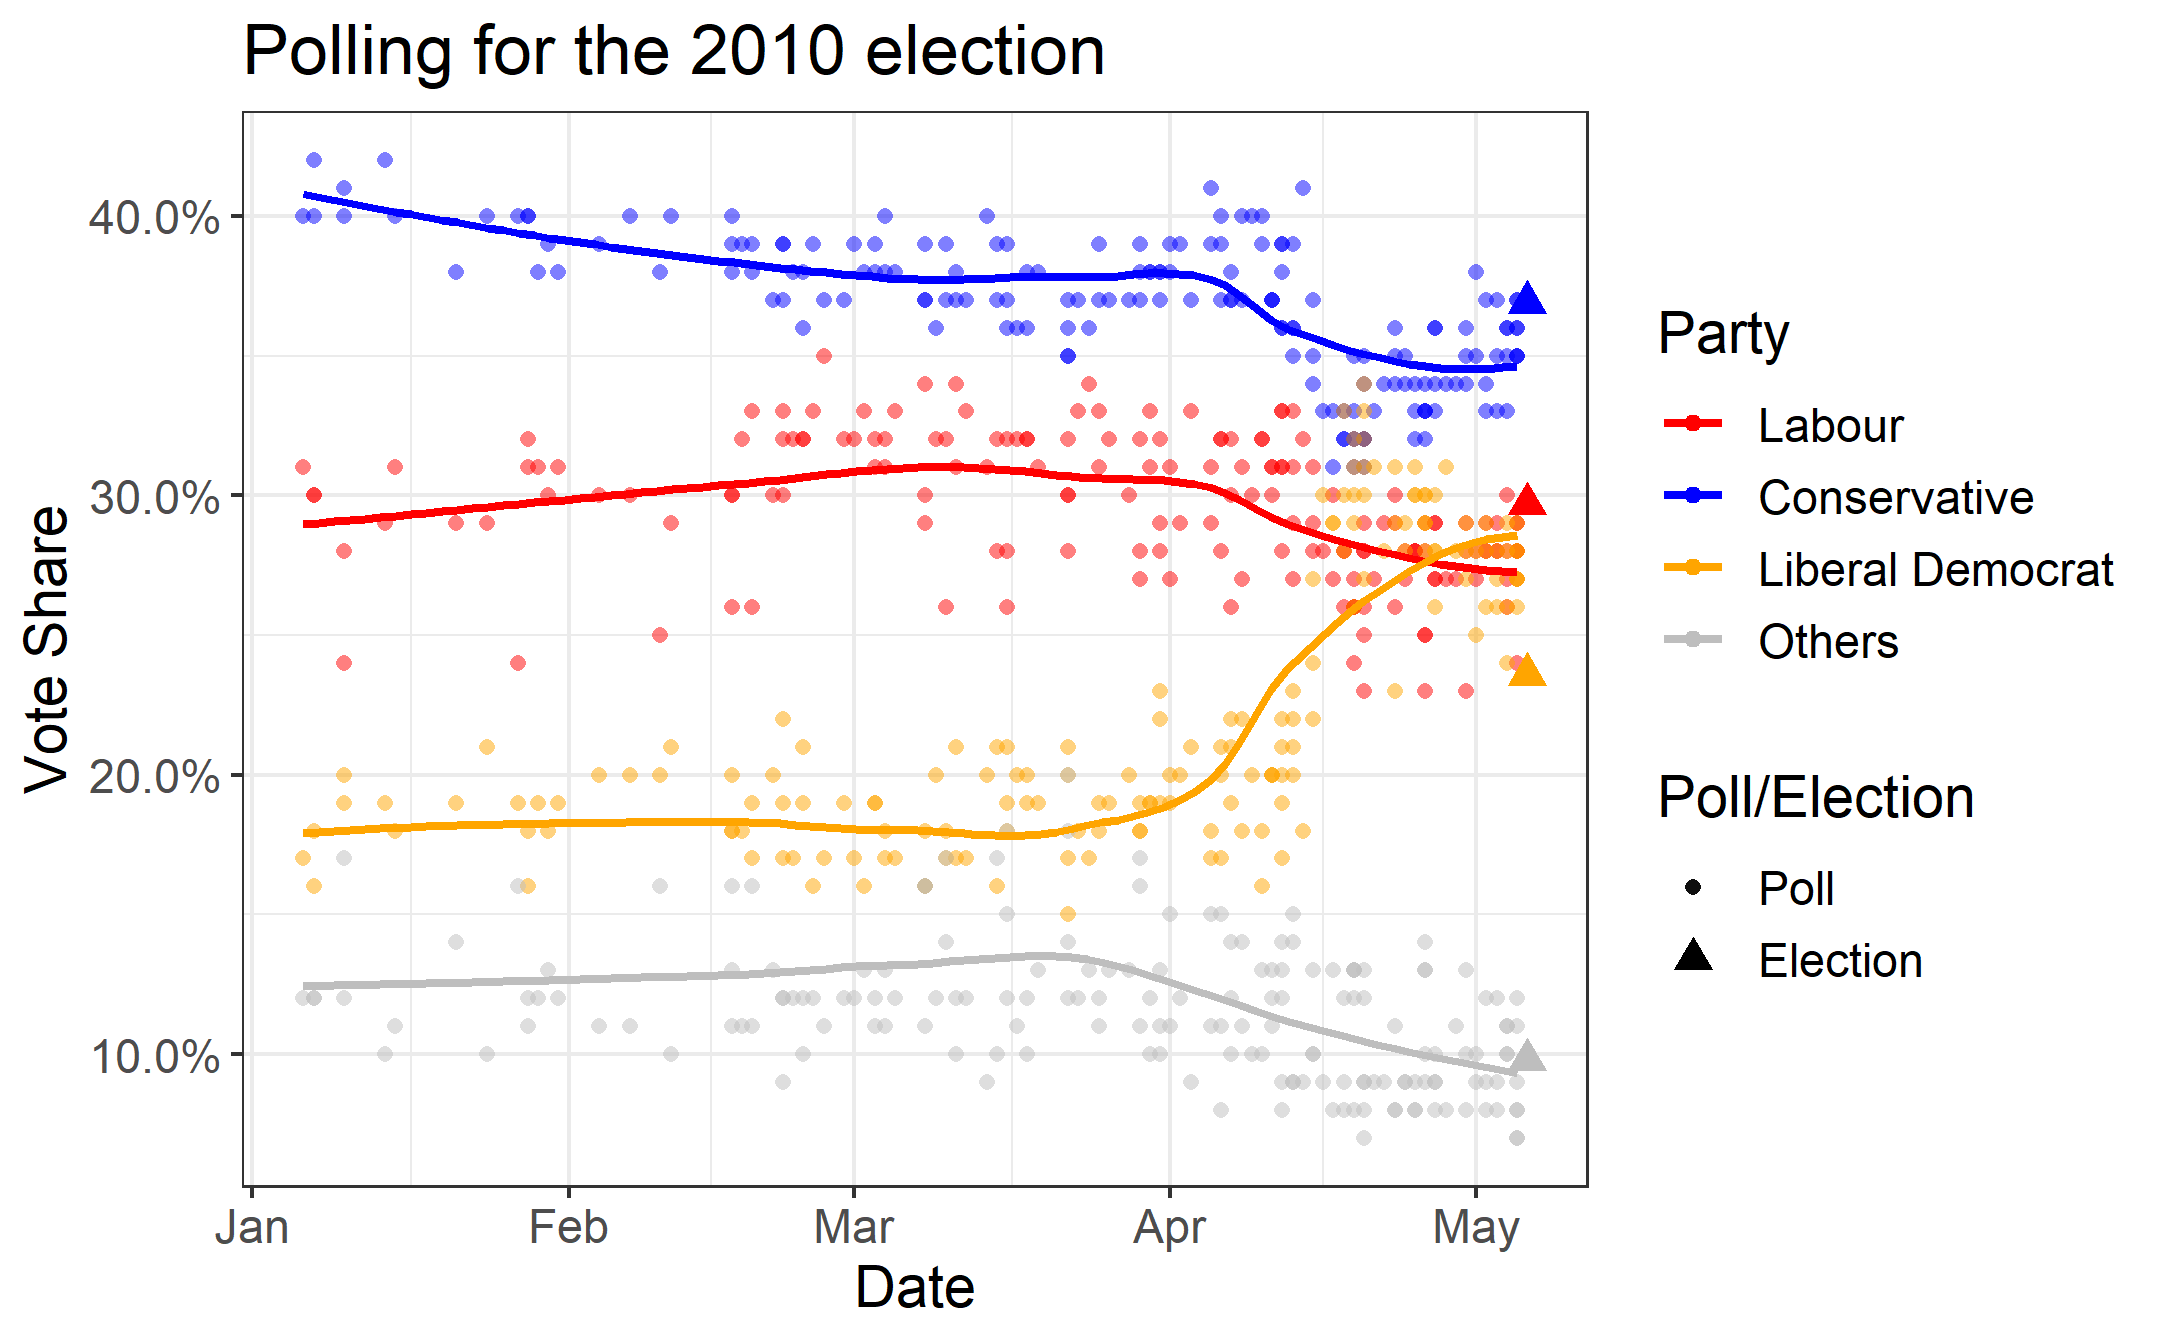
As we can see, not only did the polls fail to predict the voteshares for all but the combined other parties. What's more, the polls also got the order of the parties wrong. As they predicted that the Liberal Democrats would come second, not Labour as was the case on election day.
But how much will adding polling to the model contribute to performance? To answer that I've created the following variables for each party, created from polling data sourced from Wikipedia:
- The last poll numbers
- The average of the polls a week before the election
- The highest level of support from the polls
- The lowest level of support from the polls
- The overall linear trend of the polls
- A prediction of the final vote share
Adding these variables, and factoring for incumbancy, I was able to fit a model to predict seat results for the 2019 election. With this model specification, we would have correctly forecast the results of 88% of the seats. Again I've compared the predictions of this final model with the actual results of the election, as well as the predictions from the fundamentals model built earlier.
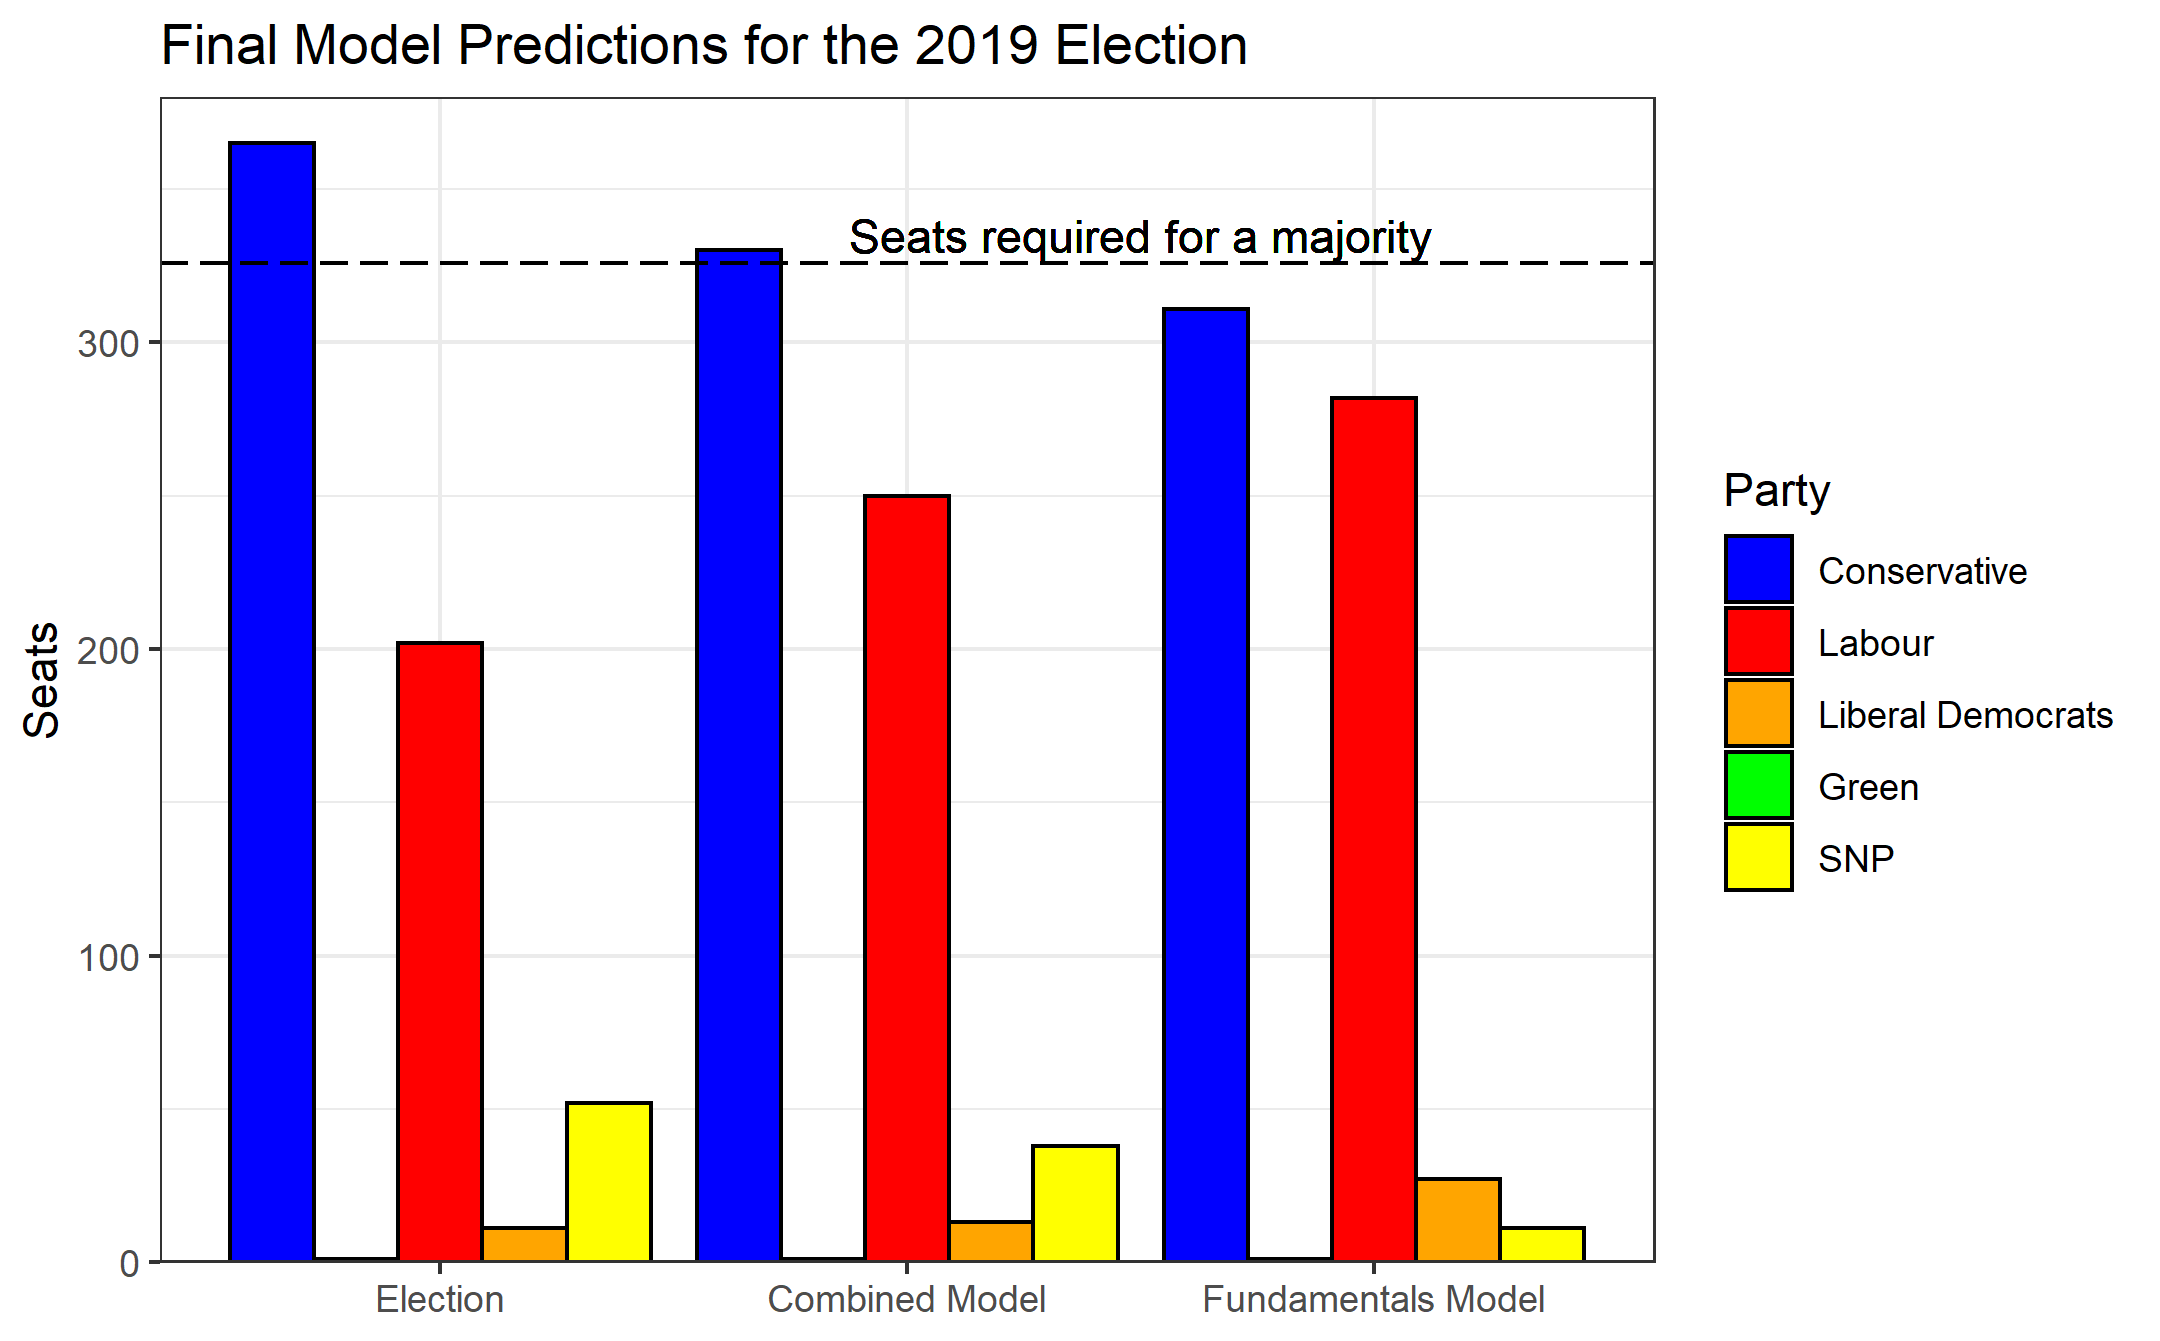
Looking at the graph, our final model was far more bullish on the Conservatives and SNP while more pessimistic on Labour and the Lib Dems. This combined model would have also correctly predicted the final overall result of the election albeit with a much smaller forecasted conservative majority of 4. But what about other predictions made prior to the election? How did our model fare compared to other forecasts?
Comparing Models
It's important to note that when we're talking about accuracy during this section, we're no longer talking about correctly predicting the results of the individual seats but the overall result. For example, let say we have a hypothetical election with three seats:
| Seat | Predicted Winner | Actual Winner |
|---|---|---|
| 1 | Party B | Party A |
| 2 | Party A | Party B |
| 3 | Party A | Party A |
Looking at the table the individual seat predictions, our model would have got an individual predictive accuracy of 33.3%. But an overall accuracy of 100% by predicting an overall majority for Party A. This will explain why the stated accuracy of our models will differ than the accuracy numbers mentioned before.
I've taken data on final predictions on the results for the 2019 elections from Elections Etc an invaluable source for election analysis. I've plotted the seat predictions from this source below with the dashed lines to represent the final seat tallies for the parties:
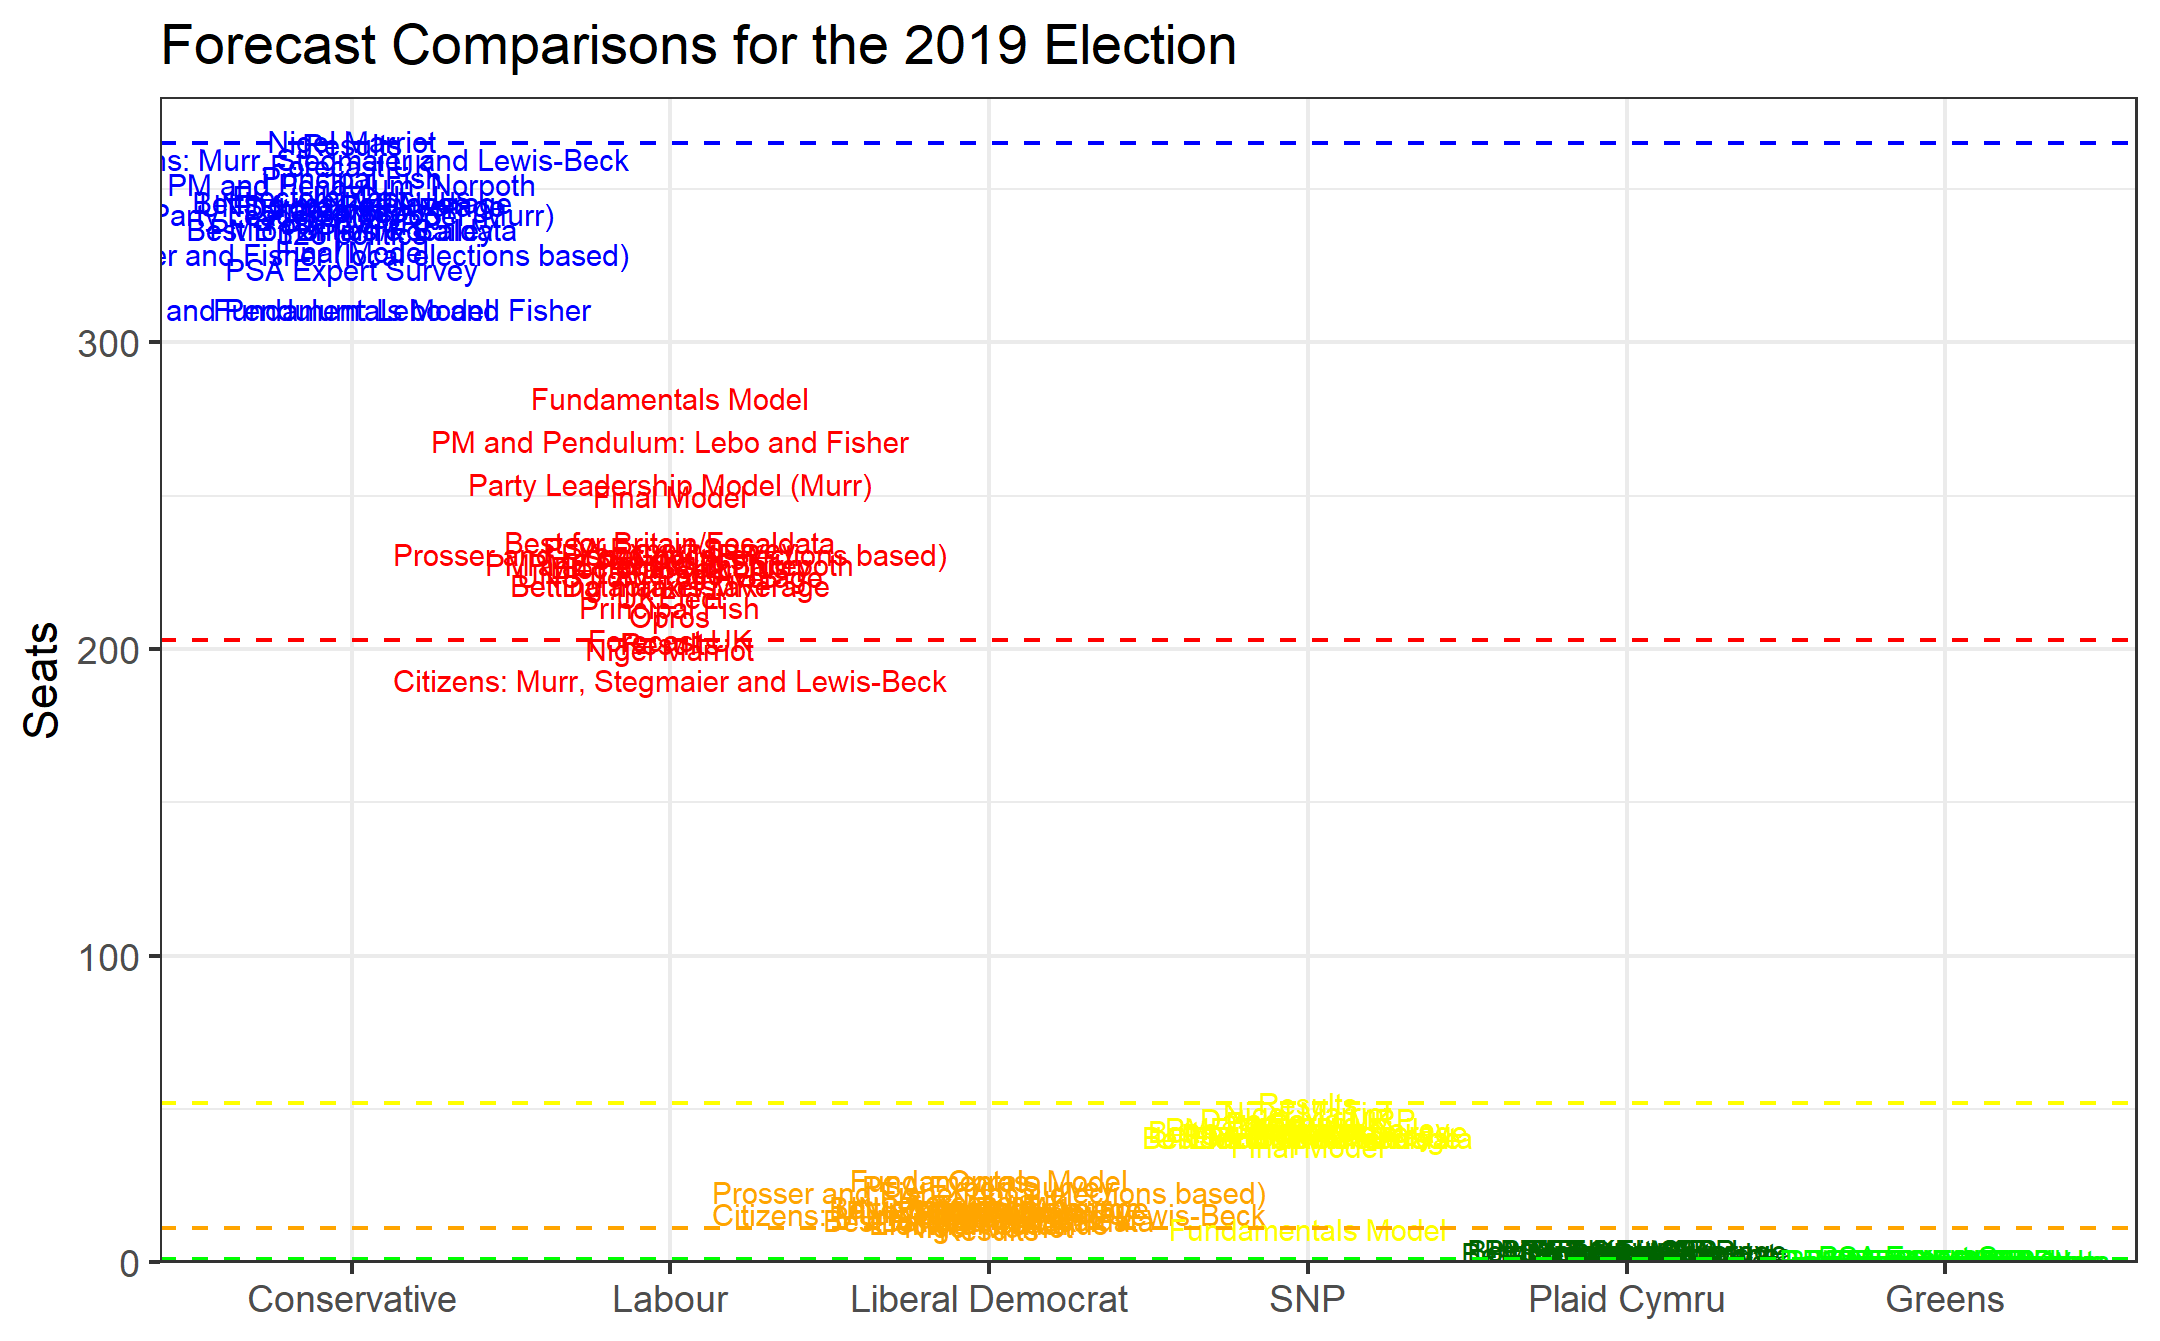
Generally, our seat predictions by party appear to fall within the wider distribution of seat projections by the other forecasters. But what about accuracy? Where does our model place compared to the others? Below I have visualised where all the forecasts stand with regards to accuracy:
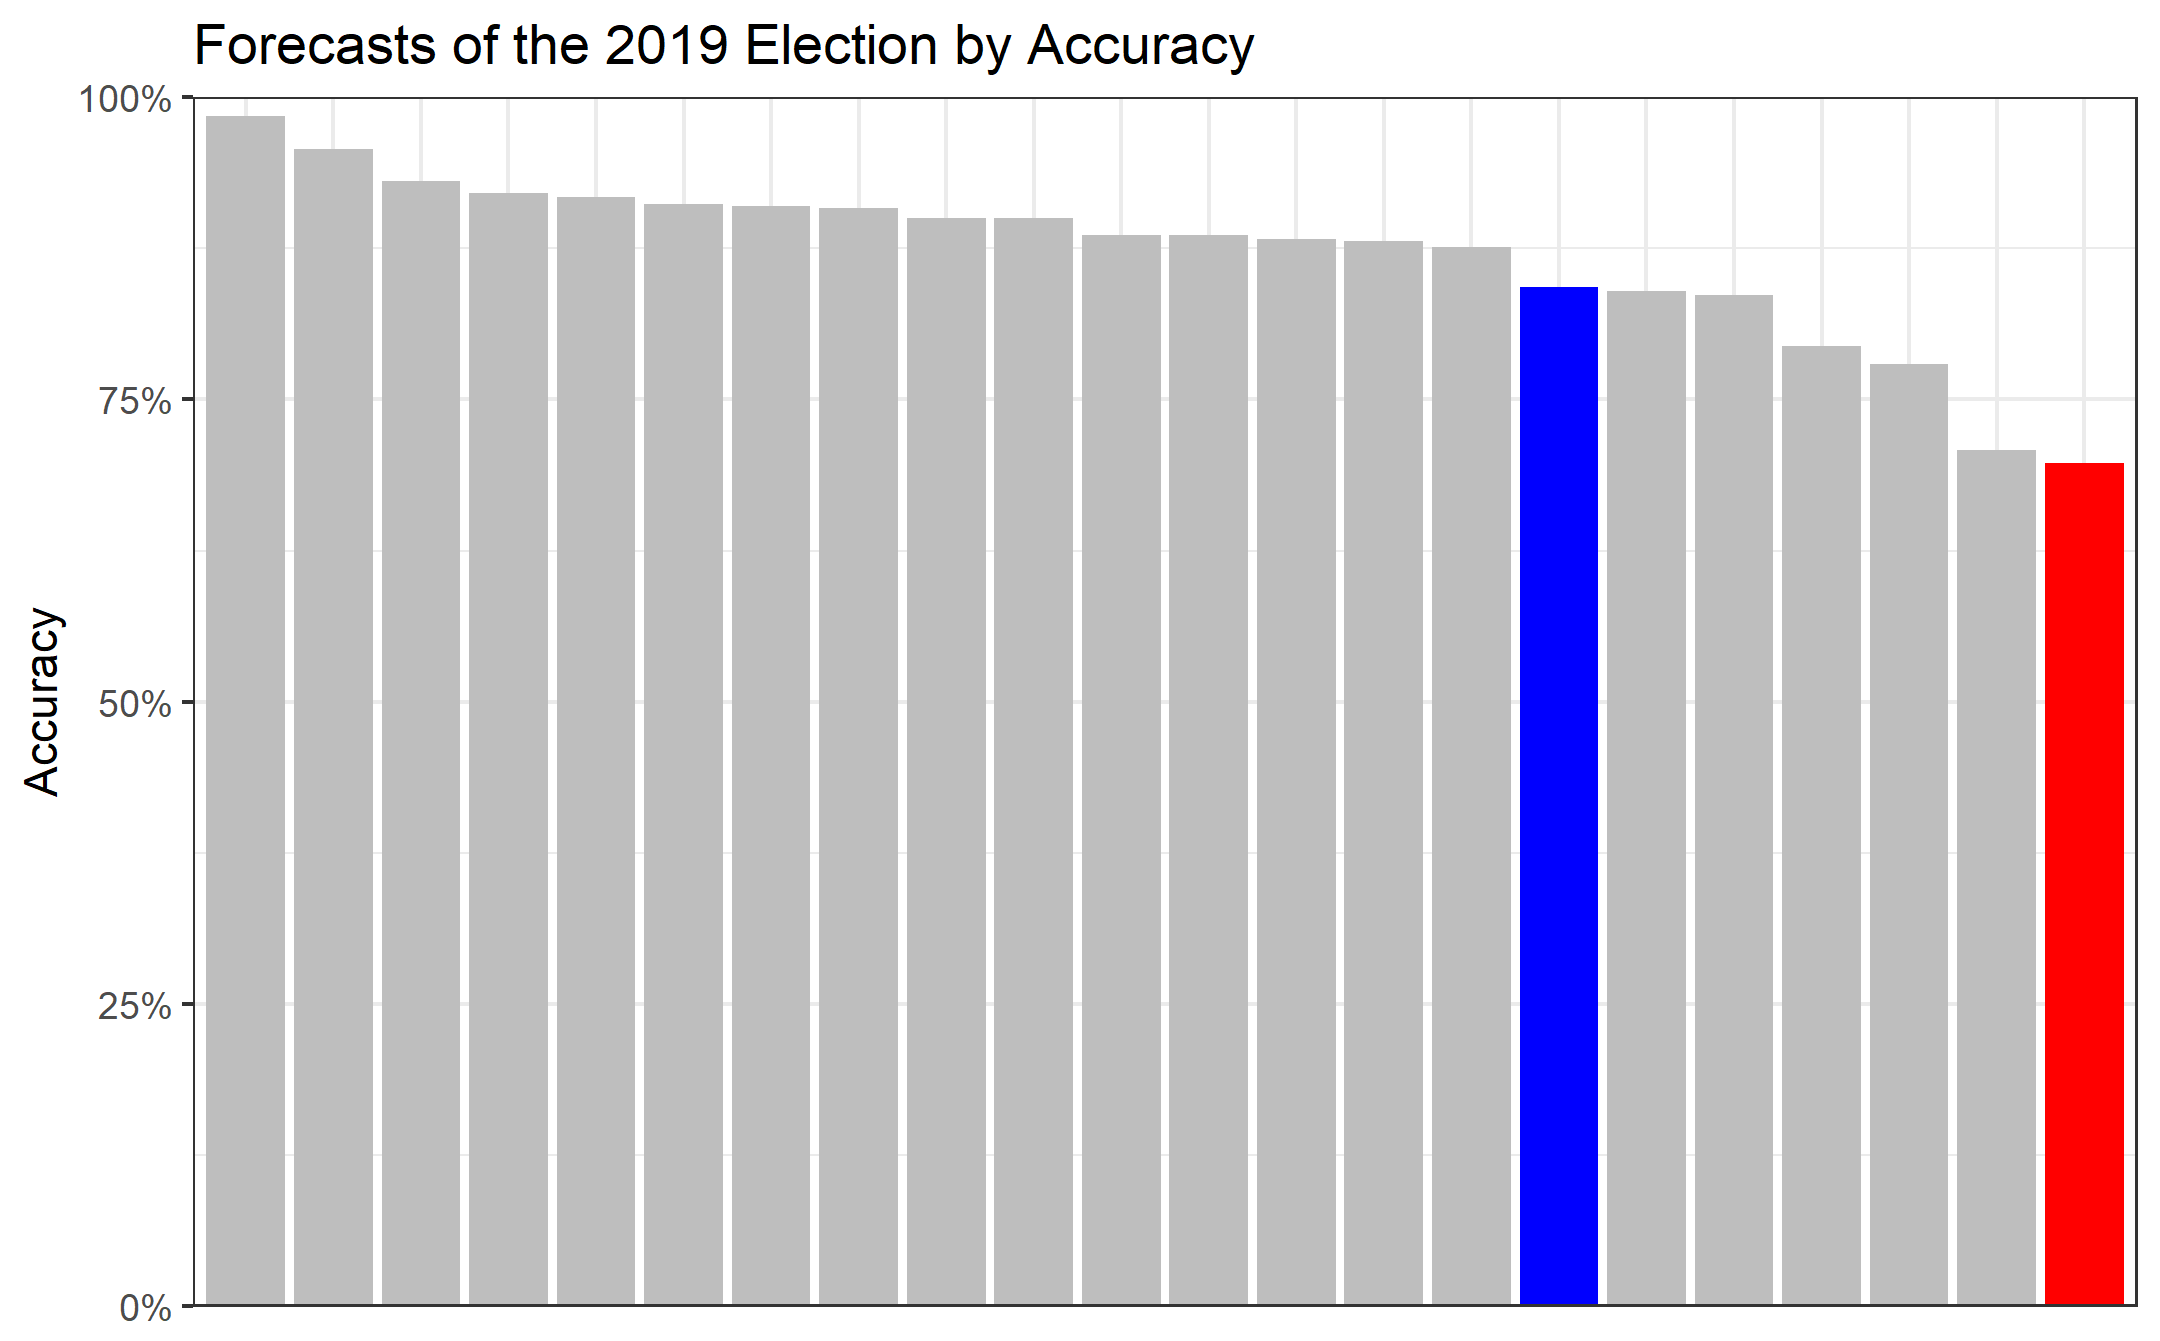
As expected, the fundementals-only model (in red) performs the worst out of all the forecasts, with the final model (in blue). Given the limited complexity of the model, as well as the number of possible additional inputs (local election results, approval ratings, etc), we should be proud of the predictive accuracy of our hastily constructed model. The next step must surely be to add these inputs and produce outputs for the next election.
Whenever that may be.